

Key information
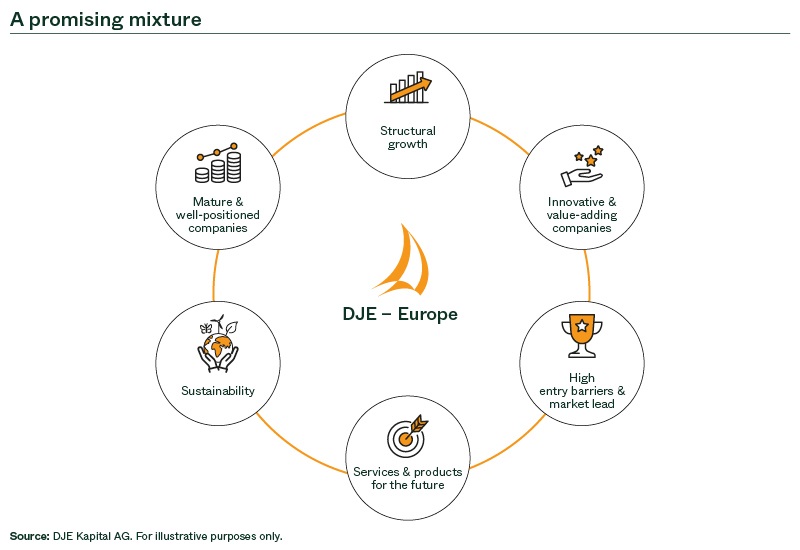
The focus of the fund is on carefully selected European equities. Security selection is not constrained or influenced by any market benchmark. The fund management follows a disciplined bottom-up scoring approach. In addition to quantitative factors such as valuation, momentum, and security & liquidity, the fund manager also takes into account qualitative criteria such as analyst assessment, and meetings with company representatives and sustainability. The 50 top European equities emerging from our bottom-up scoring process represent the main exposures of the fund. DJE - Europa aims for capital gains with a medium to long-term investment horizon.
Responsible manager since 01/01/2023
Responsible manager since 01/03/2024 as co-manager
Key information
| ISIN: | LU0229080576 |
| WKN: | A0F565 |
| Category: | Fund Europe Flex-Cap Equity |
| Minimum Equity: | 51% |
| Partial Exemption of Income ¹: | 30% |
| VG/KVG: | DJE Investment S.A. |
| Fund Management: | DJE Kapital AG |
| Risk Category: | 4 |
| This sub-fund/fund promotes ESG features in accordance with Article 8 of the Disclosure Regulation (EU Nr. 2019/2088). | |
| Type of Share: | distribution |
| Financial Year: | 01.01. - 31.12. |
| Launch Date: | 21/05/2008 |
| Fund currency: | EUR |
| Fund Size (24/04/2024): | 50,33 Mio EUR |
| TER p.a. (29/12/2023): | 0,91 % |
| Reference Index: | - |
Fees
| Management Fee p.a.: | 0,650 % |
| Custodian Fee p.a.: | 0,050 % |
Ratings & Awards (24/04/2024)
| Morningstar*: |
|
All ESG information presented here relates to the fund portfolio shown and is sourced from MSCI ESG Research, a leading provider of environmental, social and governance analysis and ratings.
| MSCI ESG RATING (AAA-CCC): | AA |
| ESG-Qualityrating (0-10): | 8,413 |
| Environment Rating (0-10): | 6,693 |
| Social Rating (0-10): | 5,811 |
| Governance-Rating(0-10): | 6,581 |
| ESG rating in comparison group (0% lowest, 100% highest value): | 95,120 % |
| Peergroup: |
Equity Europe
(1025 Fonds) |
| Coverage rate ESG rating: | 100,000 % |
| Weighted average CO₂ intensity (tons of CO₂ per 1 million US dollars in sales): | 111,553 |
Portfolio allocation according to ESG rating of individual securities
Report date: 28/03/2024
- The fiscal treatment depends on the personal circumstances of the respective client and can be subject of change in the future.
- is proprietary to Morningstar and/or ist content providers may not be copied or distributed and is not warranted ob e accurate, complete or timely. Neither Morningstar nor ist content providers are responsible for any damages or losses arising from any use of this information. Past performance is no guarantee of future results.
Perfomance Chart
Performance in Percent
Rolling performance in %
Risk metrics (24/04/2024) |
|
|---|---|
| Standard Deviation (2 years): | 13,50 % |
| Tracking Error (1 years): | - |
| Value at Risk (99% / 20 days): | -8,55 % |
| Maximum Drawdown (1 year): | -7,73 % |
| Sharpe Ratio (2 years): | 0,13 |
| Correlation (1 years): | - |
| Beta (1 years): | - |
| Treynor Ratio (1 years): | - |
Country allocation total portfolio (% NAV)
*Note: Cash position is included here because it is not assigned to any country or currency.
Data: Anevis Solutions GmbH, own illustration 28/03/2024
Top Country Allocation in % of Fund Volume (28/03/2024) |
|
|---|---|
| Germany | 24,71 % |
| France | 20,91 % |
| United Kingdom | 13,18 % |
| Switzerland | 9,35 % |
| Netherlands | 8,26 % |
Asset allocation in % of the fund volume (28/03/2024) |
|
|---|---|
| Stocks | 98,20 % |
| Cash | 1,80 % |
Investment strategy
DJE's equity research and bottom-up scoring model are used to identify the 50 most promising equities in the European investment universe. In addition to quantitative criteria factors such as valuation, momentum, and security & liquidity, the fund manager also takes into account qualitative criteria such as analyst assessment, company meeting, and sustainability criteria. The fund management aims for aportfolio diversified across sectors and countries. The portfolio consists of approximately 50 to 60 equities that are selected independent from any benchmark.
Chances
- Growth opportunities in the European stock markets
- The security selection is based on a fundamental, monetary and market-technical analysis – this FMM approach has a proven track record since 1974
- Fundamental analysis approach allows to find appropriate shares in every market phase
Risks
- Exchange rate risks
- Issuer country and credit risks
- Stock market prices may vary relatively strong due to market conditions
- Proven investment approach does not guarantee future investment success
Target group
Der Fonds eignet sich für Anleger
- with a medium to long-term investment horizon
- who require a high degree of flexibility in the structure of the portfolio
- who prefer European securities
Der Fonds eignet sich nicht für Anleger
- who seek safe returns
- who are not prepared to accept increased volatility
- with a short-term investment horizon
Monthly Commentary
As in previous months, the European stock markets largely made good progress in March. Initial fears of recession have turned into hope that a soft landing is still possible in the major economic regions. In the eurozone, the Purchasing Managers' Index for services reached 51.1 points in March, rising once again after February (50.2). This index is regarded as the most reliable economic barometer for the eurozone and suggests a modest economic recovery (values above 50 signal expansion). However, the index counterpart for the manufacturing industry fell to 45.7 points (previous month: 46.5), which indicates that the eurozone economy is still struggling with the effects of the key interest rate hikes and the rise in electricity and energy prices. In turn, the European Central Bank signalled in March that it might cut interest rates for the first time in June. Inflation in the eurozone fell to 2.6% year-on-year in February (January: 2.8%). The DJE - Europe rose by 3.36% in this market environment. Particularly pleasing results came from the retail, basic materials and energy sectors. The retail sector benefited from a significant improvement in the ifo business climate index, as both the assessment of the current situation and expectations brightened. In turn, basic materials benefited from the fact that the majority of market participants no longer expect a recession. The energy sector benefited from rising energy prices, which were attributable to geopolitical risks and uncertainties, including in the Middle East. On the other hand, the media, industrials and consumer goods & services sectors performed disappointingly or sideways, as there was little new impetus here despite the renewed economic resilience and rising energy prices weighed on industry. The fund management adjusted the sector allocation over the course of the month and increased the weighting of the healthcare and chemicals sectors in particular. In turn, it reduced the media, consumer goods & services and technology sectors, among others. At country level, the proportion of German stocks increased, while the proportion of Swiss and Dutch stocks fell slightly. As a result of the adjustments, the investment ratio fell slightly from 98.92% to 98.20%. Liquidity rose to 1.80%.